 Pome
PomeFigure 18.38.5C3609B8E3DF2
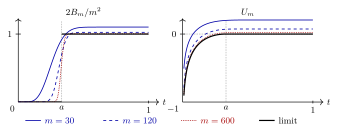
C3609B8E3DF218.38.5 The one-point model with $q=2$ and $a=1/3$. The normalized kernel density (left) and the Fubini–Study potential (right) are plotted against $t$. The black curves are their limits. The potential panel omits $t<0.01$, where the limit tends to $-\infty $.
Comments
Corrections, questions, and mathematical discussion are welcome. Sign in with GitHub to comment. Comments are public.